In a recent article, Charles Fischer laid out his observations and visions for the new Oregon defense. One of his insightful takeaways was that, under Brady Hoke, we can expect to see more turnovers and shorter opponent drives. These insights inspired this article, which projects how the Oregon offense will benefit from longer time of possession TOP) and an improved turnover margin (TO).
In recent history, the Ducks have been able to put up a lot of points in very little time. With scoring drives lasting less than one minute, the TOP is often lopsided in favor of the opposing team. Yet the score is often lopsided in favor of the Ducks.

Celebrating yet another Oregon touchdown!
Yes, Oregon scores – a lot. Year after year, the offense is ranked among the top scorers in the nation. In 2015, Oregon ranked fifth, averaging 43 points per game. In 2014, the Ducks ranked fourth in the nation, scoring 45.4 points per game. For the past seven years, 2009 through 2015, Oregon has averaged 44.6 points per game.
Over that same time period, the average TOP per game has been a mere 26 minutes and 44 seconds. That time of possession is among the lowest in the NCAA.
In fact, for the year 2015, Oregon averaged approximately 27 minutes of possession and ranked 112th in the nation. The lowest time of possession TOP belongs to Hawaii with 23 minutes per game, while the highest TOP belongs to none other than Stanford with 34 minutes per game.
So if Oregon is scoring so many points with so little time, imagine what the offense could do if it had more time. Hoke’s new defense will be aggressive. It will force TOs, sacks and tackles for loss. With that added aggressiveness, also comes risk. There may be times when big plays are given up and the opponents see pay dirt. But guess who comes marching onto the field if that happens? The Oregon offense.
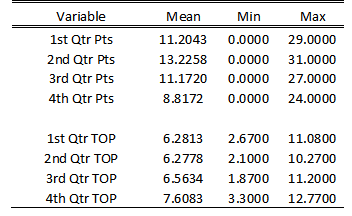
To show how the offense might benefit from a more aggressive defense, we can look at historical TOP by quarter and offensive points scored by quarter. In collecting historical data for TOP and points scored, I have excluded overtime periods.

Points scored by quarter and TOP by quarter are summarized in the table above. You can see that Oregon scores the most points in the second quarter, which just so happens to be the same quarter with the lowest TOP.
So the question is twofold, “Can we predict what might happen if the Oregon offense got more time?” and “Can we predict what might happen if Oregon increased its TO margin?”
It turns out we can. To do so, a simple ordinary least squares (OLS) regression is estimated.
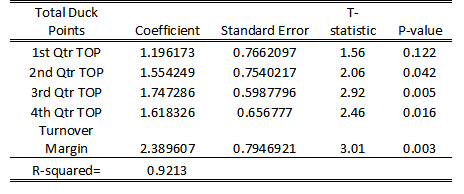
In other words, an equation is fitted and coefficients are estimated, which minimizes the difference between the dependent variable (total points scored) and the explanatory variables (quarter-by-quarter TOP and TO margin). For the detail oriented, the following table presents the results of the OLS regression.

In the table above, you see the regression results and the resulting R-squared of 0.9213. This implies that the quarter by quarter TOP and TO margin explains about 92% of the variation in total offensive points. The associated p-values in the far right column are loosely described as the probability of the true coefficient being equal to zero. As you can see all of the probabilities are very small. It may seem counter intuitive, but in this case we want those probabilities to be a small as possible.
I should make a disclaimer that this is a simple model. The intercept has been suppressed, and all sorts of other variables have been left unaccounted for. But, it has often been written that forecasting is as much art as science. Let’s just say I’m being a little artsy here. In other words, I’m not being academically disciplined about my specification.
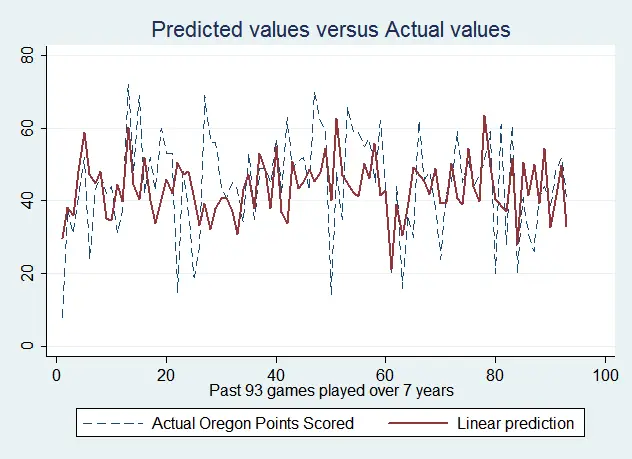
But we’re not interested in identifying causality here, we’re exploiting the data to identify patterns, which allow us to make interesting forecasts. Besides, this is purely for entertainment purposes, and sometimes you just need to play fast and loose – just like our beloved Ducks! – with this stuff. And as you can see, this simple model happens to fit the data very nicely.

In the plot above, you can see that the predicted values fit nicely over the actual values. You wouldn’t want to bet the farm on this. Clearly there are times where the model over-predicts and under-predicts, but on average, the model seems to approximate the true pattern fairly well.
Suppose Oregon improved their TOP by three minutes per game to average 30 minutes per game. This would put Oregon in line with other teams that run a spread offense matched with a 4-3 defense. For example, the Tennessee Volunteers are in this situation, and the Vols averaged 30 minutes of possession per game last year.
If those extra three minutes are spread across the first three quarters, that would give the offense an extra minute per quarter. Over the past seven years, Oregon has generally outscored their opponents by a large enough margin, that the fourth quarter is often spent running out the clock and playing prevent defense.
This is evidenced by the largest average TOP and smallest average points scored occurring in the fourth quarter. So any additional TOP created by an aggressive defense is assumed to occur in the first three quarters.
In the past seven years Oregon has averaged a TO margin of 0.88 per game. However, in 2015, that figure fell to just 0.38 per game. So for prediction purposes, I presume the new 4-3 defense returns Oregon back to the seven-year average.

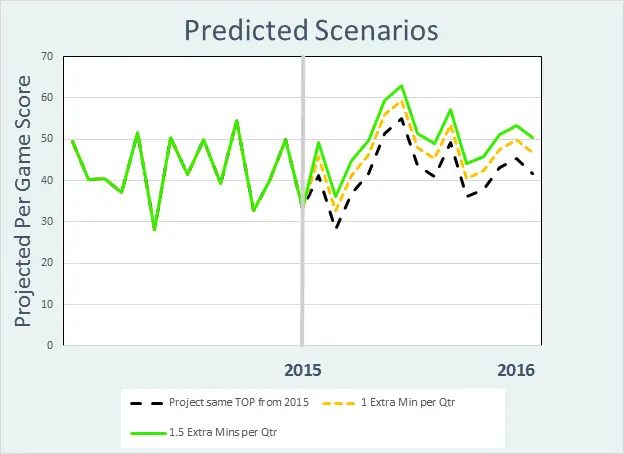
Three different scenarios are predicted.
The first assumes Oregon’s TOP is unchanged from the 2015 season and the average TO margin also remains unchanged from the 2015 season. This is represented by the black dashed line. Here, the 2016 offense is predicted to average 41.7 points per game.
The second scenario assumes the average TO margin returns to the seven-year average of 0.88 per game and the time of possession is increased by one minute per quarter in the first three quarters. This is represented by the yellow dashed line in the above figure.
Given these assumptions, the Ducks are predicted to increase their average points per game to 46.8. No doubt Oregon fans would be happy with that figure. Last year, the Ducks averaged 43 points per game and ranked fifth nationally in the category. Increasing the average points per game to 46.8 would place the Ducks second nationally, ranked only behind Baylor who had 48.1 points per game in 2015.
For the third scenario, the average TO margin is assumed to be 0.88 and time of possession is increased by 1.5 minutes per quarter in the first three quarters. Oregon would be averaging a time of possession of 31.5 minutes per game. This is certainly a reasonable expectation given that 47 teams averaged a time of possession of 31 minutes or better.
For example, Arizona State, TCU, Oklahoma, Colorado, and Houston all averaged a time of possession of 31 minutes in 2015. If this scenario should materialize, my model predicts Oregon to average 50.3 points per game!
In the past 11 years, only eight teams have averaged over 50 points per game, the last to do so being Baylor’s 2013 squad with an average of 52.4 points per game. Oregon would certainly be in elite company.
The 2016 season looks to hold promise. The offense is loaded to the teeth with elite play makers, and there is mounting expectations for an intense, attacking defense. Not only is it reasonable to foresee the Ducks scoring 50 points per game, 2016 may just be a year of broken records.
Evan Markel
Statistical Analyst for FishDuck.com
Knoxville, Tennessee
Top Photo by Craig Strobeck
Evan is a native Oregonian who grew up in the historic town of Oakland, once known as the Turkey capital of America. Evan attended the University of Oregon and is a Lundquist College of Business alumnus, and he has a Masters in Statistics and a PhD in Natural Resource Economics from University of Tennessee
While at Oregon he attended nearly every home football game and fostered his love for all things Oregon Duck. He now works for Ernst & Young amid the Huskies in downtown Seattle, and loves using his skills to study his beloved Ducks.


