I knew it was coming, it always does, my buddy Frank and his Husky purple heart calling to give me grief over the Ducks losing their PAC-12 baseball series to the Huskies. I’ve known Frank for a lifetime, and he has been a deep shade of Husky purple since we were neighbors and classmates in elementary school.
His father, the son of an Eastern Washington wheat farmer, lettered three years in football as a Husky, plus Frank and two of his daughters are holders of some sort of degrees from the school.
Of course, I never hear from him when the Duck’s absolutely crush the Huskies (10 years in a row in football) and I’m not going to encourage him by returning the courtesy when the winning Duck’s prevail. The Ducks need not gloat over their habit of winning as others will do with victories that become anomalies on their schedule. However, Frank raised the hackles on my neck with a couple of comments about the failure of our relief pitching and implying confidence in the Duck’s bullpen was misplaced. He recklessly quoted Earned-Run-Averages of the Duck’s relievers while laughing about the success of Husky hitters in facing them.
Yes, it is true, in the Sunday game of the Husky series, the Duck’s relief pitching did not have the kind of success we are accustomed to enjoying, however this singular performance had nothing to do with Earned-Run-Averages (Commonly referred to as a pitcher’s ERA.) nor the talent of Coach Horton’s pitching staff.
Frank obviously did not understand Earned-Run-Averages or the caveat that must be applied when evaluating a pitching staff. Frank’s call and a discussion we overheard in the stands at the Duck’s road game at Joe Etzel Field in Portland suggested a simple analysis of pitching ERAs would be helpful.
How is the Earned-Run-Average developed? A pitcher’s ERA is a tool which provides the average number of earned runs a pitcher allows per 9 innings pitched.(9 innings being the designated length of a baseball game.) The calculation is simple, the total earned-runs allowed by a pitcher in all appearances are tallied and divided by the total innings a pitcher has worked. This product is the earned runs scored per inning against a pitcher. This result is multiplied by 9 to give the average number of earned runs allowed per 9 innings pitched. Thus the pitcher’s ERA is established.
Earned Runs/Innings Pitched X 9 = ERA
“Earned-runs, don’t they all count?”, we heard in the stands. Yes, they all count, however the “Earned Run” delineation versus all runs scored is a sub-data tool used in the evaluation of pitching performance.
If the teams right fielder commits an error by dropping a fly ball and the batter reaches 2nd base and the next hitter drives a pitch to the outfield for a single, allowing the runner on 2nd base to score, that run is said to be an unearned run relative to the pitcher’s contribution to the scoring process. It is said the runner was on 2nd not due to the pitcher’s action, but because of the error by the outfielder, thus the run was not earned relative to the pitcher’s performance.
However if the runner on 1st base, having hit safely, later scores that run would be deemed an “earned-run” because the runner was on base due to the pitcher’s performance. All runs scored are counted, however we look at what led to the opponents runs to determine the level of a Duck’s pitcher’s performance.
When we know how ERAs are developed, it becomes readily apparent that earned-runs-per-nine-innings-pitched (ERA) is a valuable statistic in evaluating a pitcher’s performance. The lower the earned runs allowed per game, the higher the probability that a given pitcher is going to allow the team to outscore their opponents thus producing wins.
Relief pitchers work fewer innings than starters thus their ERAs tend to be somewhat higher. A relief pitcher can have a bad outing and the subsequent ERA becomes astronomical. There is a Duck’s pitcher, working out of the bullpen, who carries a 36.00 ERA although he has given up but 4 earned runs, however he has worked just 1 inning thus the astronomical ERA. When a relief pitcher has a bad ball game it takes a lot of appearances before his ERA will become respectable.
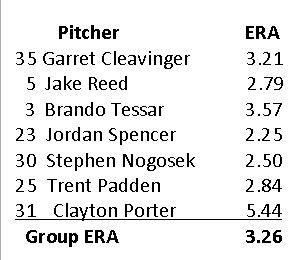
If we look at the Duck’s most active bullpen pitchers, it becomes apparent that Coach Horton is getting great relief work from his bullpen.
Jordan Spencer’s 2.25 ERA is outstanding for someone working out of the bullpen however there are other statistical tools available in evaluating the work of the Duck’s bullpen. Brando Tessar (A player whose arm really impresses this observer.) is the leader in strike-to-Walk-ratio at 25 to 1 while Jake Reed has given-up the highest number of walks (His Seattle nightmare!) but, his batting average against is the lowest of bullpen group at .159. All-American Garret Cleavinger is the bullpen strikeout leader at 25. The bullpen ERAs listed above are excellent for the bullpen portion of the pitching staff.
Despite purple Frank’s comments and some negativity we’ve overheard in the stands, the ERAs for the Duck’s relievers are excellent and it is apparent that the Duck’s relief pitching staff has been doing excellent work. When one considers the loss of freshman Saturday-Starter Matt Krook and All-American left hander Cole Irvin to injury, the Ducks are getting very good relief pitching.
Until we see you at P.K.Park
Gar says, “Take two and hit deep to right!”
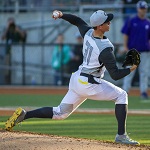
Photos above from video!
–
Related Articles:
Seven Offensive Coordinator Candidates for the Oregon Ducks
Five Candidates to Replace OC Marcus Arroyo
Coach Jim Mastro: The Perception, and the Truth
Has Oregon Turned the Corner on Offense?
Ducks, Taggart Punish Beavers; Earn Bowling Trip
Textbook Defense, Herbert's Return Energize Duck Victory; Civil War Next
Gar is a businessman, writer, father of 4 very successful children and an enthusiastic life long Duck follower. He remembers being a fair country boy athlete and spent a summer playing baseball in the Dodger organization. Playing is using the term loosely as he remembers primarily being asked to carry the equipment to the bus. He has spent 20 years assisting FEMA in providing Housing for disaster victims.


