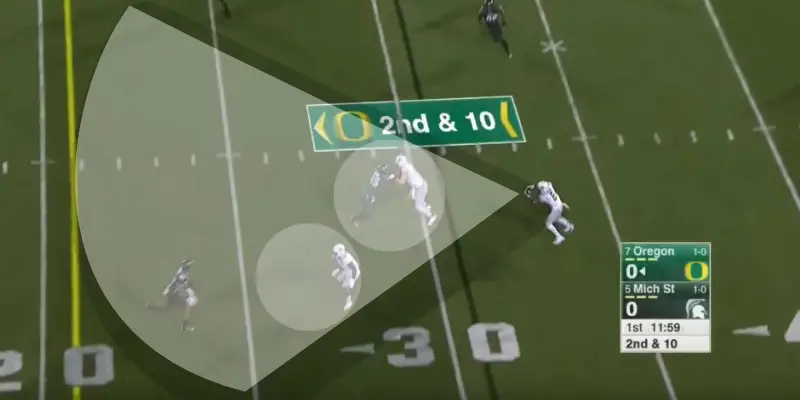
Today, we are going to compare two Oregon teams of the past with different offensive schemes against the same opponent and style of defense: the Michigan State Spartans (MSU). The 2015 Oregon Ducks (9-4) played MSU in the second game of the season, and the 2018 Oregon Ducks (9-4) faced MSU in the RedBox Bowl, our most recent game.
After looking at 72 Oregon pass plays from two different Oregon teams, I have crunched the numbers, and there is one statistic that shouts out a big difference between the two that likely isn’t related to any differences in defense, offense or personnel.
This article does not draw many conclusions, but it does point you in a direction. What I would like to do is share the statistics below with you, then let you make your own observations. The answer is not clear-cut to me. We will start by overviewing the basic passing statistics in the game, ones that I developed after going through every pass play. And then we will breakdown the one thing that jumps out from the page, the one big difference between Mark Helfrich’s 2015 team and the 2018 Mario Cristobal team.
Quarterbacks: Vernon Adams (2015) and Justin Herbert (2018)
No, it is not fair. There is no way to do a comparison across players, across years, across different teams and opposing defenses. It is one game. The complaint is registered and noted. The question that I am raising is a simple one: is there a statistic so glaring that it lends itself to further investigation? In short, I have tossed strands of spaghetti against the ceiling to see if anything sticks (when it sticks, the spaghetti is done).
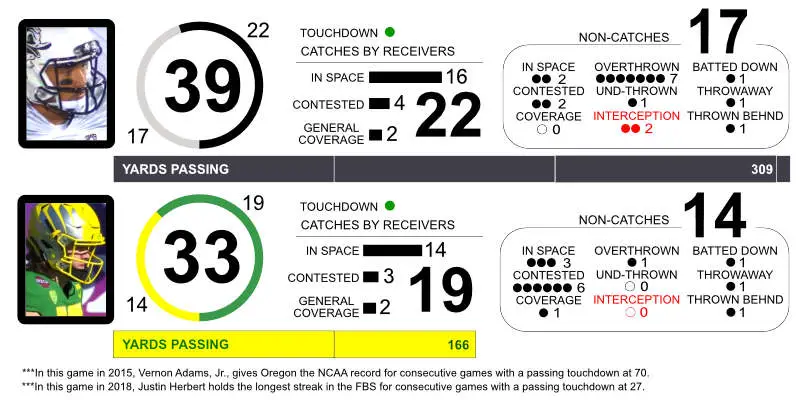
2015 vs. 2018
Both quarterbacks were almost the same percentage-wise in number of catches in space, number of contested catches and catches made by a receiver in coverage.
By space, I mean the receiver had time to gain possession of the ball before defender contact. By contested, I mean that during the process of gaining or trying to gain possession, there is defender contact. By coverage, I mean the defender is near — usually trailing — but there is time to secure the ball before contact; that is, there’s pressure but no contact.
Note: Adams had been with the team just four weeks but injured his index finger on his throwing hand in the previous game, and I suggest this may be a variable in the large number of overthrown balls.
2015 Perimeter Blocking vs. MSU
2015. East Lansing, Michigan. No. 7 Oregon at No. 5 Michigan State. First quarter. First drive. Sixth play. Oregon is moving. It’s 2nd and 10. Adams tosses the ball (red dot) to Charles Nelson.
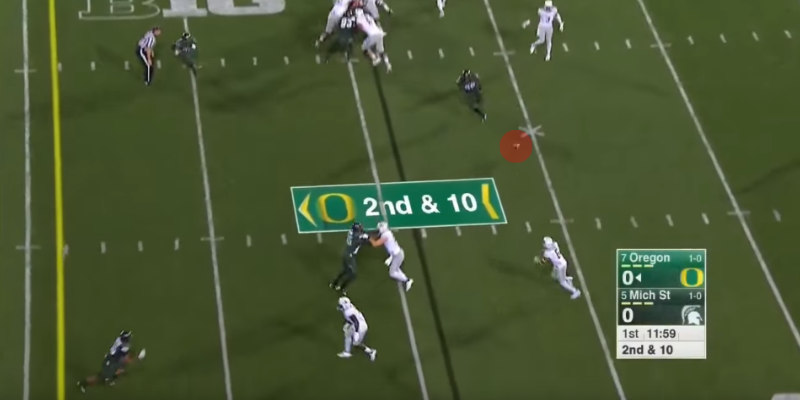
Here is what Nelson sees once he secures the ball two yards behind the line of scrimmage:
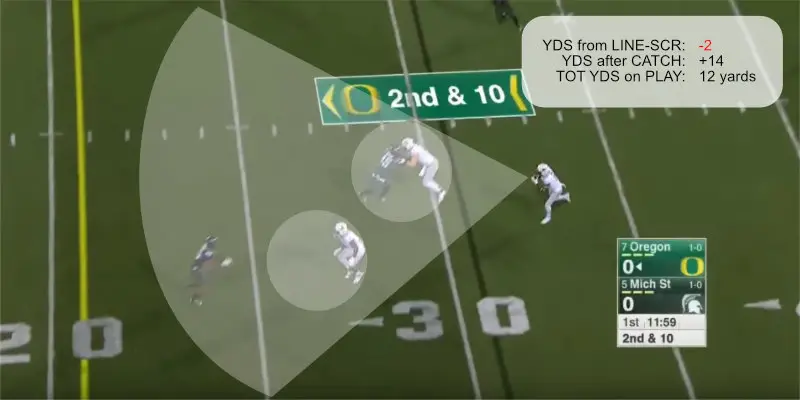
With blocking in front of him, Nelson creates an additional 14 yards for a net gain of 12 yards: first down, drive continues. Time and time again against Michigan State, the 2015 Oregon Ducks’ tight ends and receivers created running lanes for each other by team blocking.
The impact? In the first drive of the game in 2015, Oregon receivers caught the ball for a total of eight yards beyond the line of scrimmage, but they had 44 yards after the catch. The result when adding in the running game: touchdown. Ducks up 7-0.
Yards After Catch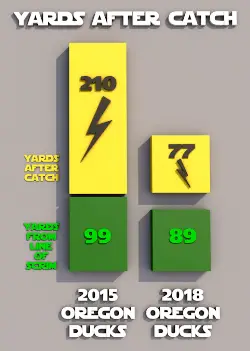
So, here is the big statistical difference between the two teams in 2015 and 2018 versus Michigan State: yards after catch. Against the same opponent and similar style of defense, the 2015 Oregon Ducks team had 210 yards after catch, almost 300% more than the 2018 Oregon Ducks team with 77 yards.
When I saw this, I wondered: why? Was it the scheme difference (Helfrich spread vs. Cristobal scheme)? Was it the talent in wide receivers? Could it be something else? I went back through the catches, and I can only give you a sampling of what I think was one issue. (Review the statistics above because I think there is a hint in there.)
2018 Oregon Perimeter Blocking vs. MSU
Fast-forward to the 2018 RedBox Bowl. First quarter. Third drive. It’s 1st and 10. Justin Herbert has a nice pass to Dillon Mitchell, as he catches the ball three yards behind the line of scrimmage.
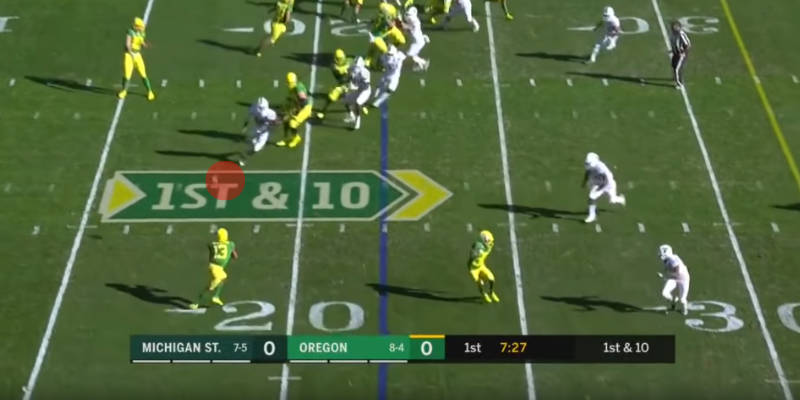
Mitchell has one blocker (Jaylon Redd) in front of him here, and two defenders collapsing. It’s a two-on-two: two greens vs. two whites.
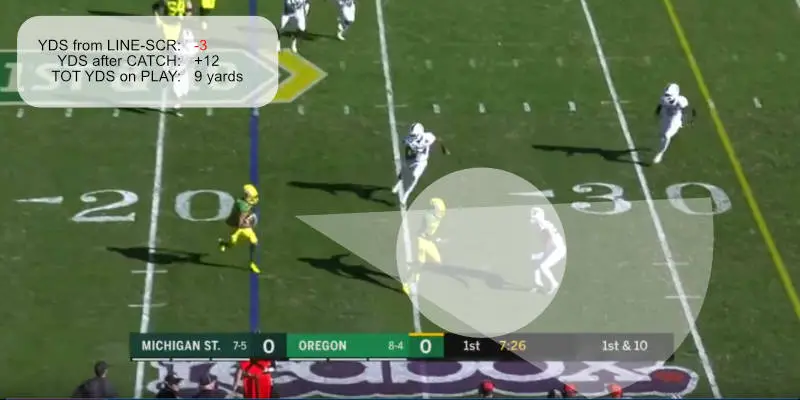
Mitchell finishes this play off with great acceleration right behind his blocker, moving 12 yards for a net gain of nine yards as a third defender closes in. The drive continues, and it’s 2nd and 1. Great blocking by Redd. He’s the big hero on this play, along with some great running by Mitchell.
The purpose of showing a similar play to the 2015 Oregon offense is to demonstrate the that the concept of yards after the catch were understood by both Oregon teams — different coaches, different schemes and different receivers across the years, but the same principles of success. Blocking receivers help create yards after the catch in many circumstances. Are they being consistently executed?
We’re still in the 2018 RedBox Bowl, and it’s the same drive. First quarter. On the previous play (2nd and 4), Justin Herbert tossed a well-thrown ball to Mitchell, and, in coverage, it clunked off his helmet. Incomplete pass. 3rd and 4.
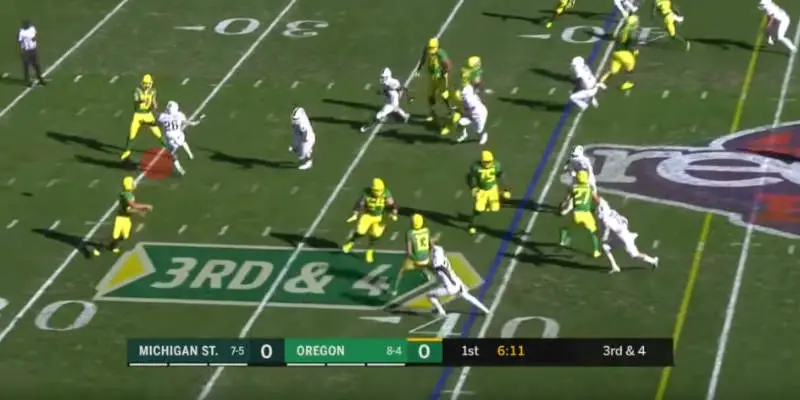
We are lining up to keep the drive alive. Herbert is going to set in a nice soft throw to Travis Dye on a screen play. Here’s how the play begins to form as the ball is hiked. Tight end Jacob Breeland (No. 27) and receiver Mitchell (No. 13) are the main blockers in the play.
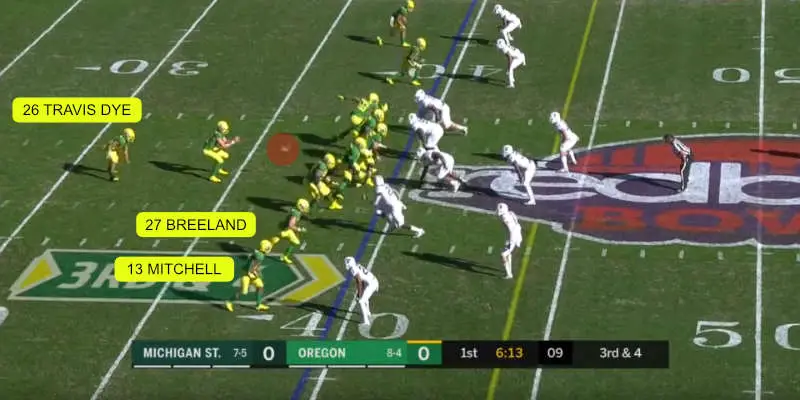
Dye is eight yards behind the line of scrimmage (the blue line). He has to get that eight yards back and then go at least four more for a first down (the yellow line). Dye is focusing on catching the ball. Below, No. 54 Calvin Throckmorton and No. 75 Dallas Warmack swing over in pursuit of their quarry to clean up any blocking problems that remain. It’s five greens versus three whites on the right side of the field. The odds are in our favor, except … do you see it?
Here’s another angle.
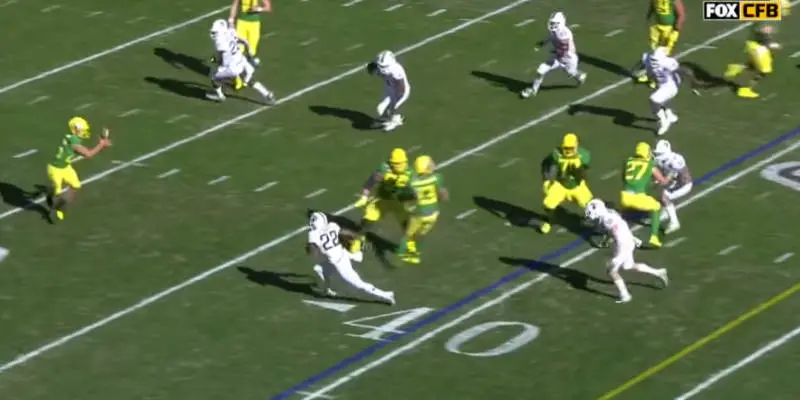
Dye secures the ball and turns around … where are his blockers?
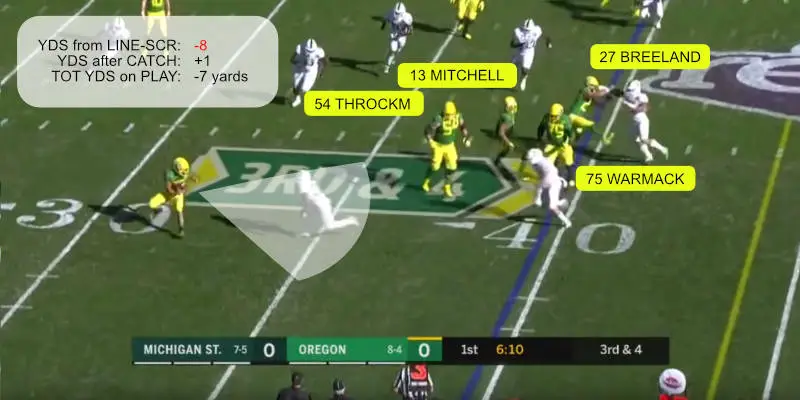
In one second, the play went from a five-on-three to a one-on-one. Look at No. 27, Breeland (upper right), one of the play’s main blockers; he’s all tangled up and blocking, doing his part off the line of scrimmage (nice job, Jacob). Throckmorton and Warmack are ready to clean up, but Mitchell turned back in on the play, effectively sealing off Throckmorton from getting involved.
Dye doesn’t have any time to make a move and is wrapped up by the defender for a 7-yard loss. On the next play, the Ducks punted, and by the end of the game, a TV announcer stated that the Ducks now hold the RedBox Bowl record for punts in a game (11).
Conclusion
First, let me admit that it is not wise to take one game, or even a couple of plays, and draw large conclusions from it. What can be said with certainty is that the difference in “yards after catch” between the 2015 Oregon Ducks and 2018 Oregon Ducks versus Michigan State’s defense is so significant as to indicate that it might be a trend worth evaluating.
When compared to the previous Oregon spread scheme, is the relative lack of yards after catch a weakness in Cristobal’s new scheme? Or, is this a coaching issue, where blocking techniques are not being emphasized? Is it a player issue?
As fans, we can start looking at the passing plays next year and move our eyes ahead of the ball to see how the blocking is looking for the receiver with the ball. Until then, let’s root for our beloved Ducks and welcome our new wide receivers coach, Jovon Bouknight, and hope that his influence along with the influx of talent at wide receiver position will lead to more positive results in the future.
Ugly Duckling
Migrating to Oregon Top Photo From Video

Chris Brouilette, the FishDuck.com Volunteer editor for this article, is a current student at the University of Oregon from Sterling, Illinois.
Related Articles:
FishDuck Foaming Over Upside of 2026 Diamond Ducks
Unbelievable...Same SEC Stuff, Different Day
Why Oregon Football Always Belongs in the National Conversation
The B1G Won the 2026 Coaching Carousel...Big-Time!
Continuity? Lanning's Hiring Success is Put to the Test
Why Whether Dyer Was Down or Not...Doesn't Matter
Ugly Duckling was part of a flock that migrated from east of the Cascades many seasons ago, was raised in Willamette Valley Ponds, and is proud to be part of the green and yellow.

